> ## Documentation Index
> Fetch the complete documentation index at: https://docs.flipt.io/llms.txt
> Use this file to discover all available pages before exploring further.
# Observability
> This document describes how to configure observability mechanisms including metrics, logging, and tracing for Flipt v2.
## Metrics
### Prometheus
Flipt exposes [Prometheus](https://prometheus.io/) metrics by default at the `/metrics`
HTTP endpoint. To see which metrics are currently supported, point your browser
to `FLIPT_HOST/metrics` (ex: `localhost:8080/metrics`).
You should see a bunch of metrics being recorded such as:
```yaml theme={null}
flipt_cache_hit_total{cache="memory",type="flag"} 1
flipt_cache_miss_total{cache="memory",type="flag"} 1
---
go_gc_duration_seconds{quantile="0"} 8.641e-06
go_gc_duration_seconds{quantile="0.25"} 2.499e-05
go_gc_duration_seconds{quantile="0.5"} 3.5359e-05
go_gc_duration_seconds{quantile="0.75"} 6.6594e-05
go_gc_duration_seconds{quantile="1"} 0.00026651 go_gc_duration_seconds_sum
0.000402094 go_gc_duration_seconds_count 5
```
You can disable the Prometheus metrics collection by setting the
`metrics.enabled` configuration option to `false`.
### OTLP
Flipt supports sending metrics to an [OTLP](https://opentelemetry.io/docs/concepts/data-collection/) collector.
OTLP supports additional configuration such as specifying the protocol to use (gRPC or HTTP) as well as providing custom headers to send with the request.
Custom headers can be used to provide authentication information to the collector which may be required if you are using a hosted collector such as [NewRelic](https://docs.newrelic.com/docs/more-integrations/open-source-telemetry-integrations/opentelemetry/get-started/opentelemetry-set-up-your-app/), [DataDog](https://docs.datadoghq.com/opentelemetry/otlp_ingest_in_the_agent/?tab=host), or [Honeycomb](https://docs.honeycomb.io/getting-data-in/opentelemetry-overview/#instrumenting-with-opentelemetry).
OpenTelemetry OTLP metrics are configured via the default OpenTelemetry Environment Variables. See the [OpenTelemetry Environment Variables](https://opentelemetry.io/docs/reference/specification/sdk-environment-variables/) documentation for more details.
For example, to configure the OTLP metrics endpoint, you can set the `OTEL_EXPORTER_OTLP_METRICS_ENDPOINT` environment variable.
```console theme={null}
export OTEL_EXPORTER_OTLP_METRICS_ENDPOINT=http://localhost:4317
```
To configure the OTLP headers, you can set the `OTEL_EXPORTER_OTLP_METRICS_HEADERS` environment variable.
```console theme={null}
export OTEL_EXPORTER_OTLP_METRICS_HEADERS="Authorization=Bearer "
```
## Logging
Flipt writes logs to STDOUT in two formats:
* [JSON](#json)
* [Console](#console)
The format can be configured via the `log.encoding` configuration option.
```yaml theme={null}
log:
encoding: json
```
For production deployments, we recommend using the JSON format as it's easier to parse and ingest into log aggregation systems such as Elasticsearch, Splunk, Loki, or Datadog.
### JSON
```json theme={null}
{
"L": "INFO",
"T": "2024-01-20T21:59:49-05:00",
"M": "finished unary call with code OK",
"server": "grpc",
"grpc.start_time": "2024-01-20T21:59:49-05:00",
"system": "grpc",
"span.kind": "server",
"grpc.service": "flipt.evaluation.EvaluationService",
"grpc.method": "Boolean",
"peer.address": "127.0.0.1:52635",
"grpc.code": "OK",
"grpc.time_ms": 0.146
}
```
#### Log Key Descriptions
* `L`: Level (log level). Possible values include: debug, info, warn, error, fatal, and panic.
* `T`: Timestamp. The timestamp is in ISO 8601 format, widely used for representing date and time. It includes the date, time, and time zone information. For example, "2024-01-20T21:59:49-05:00" represents the date and time in the Eastern Time Zone (UTC-5).
* `M`: Message. The message describes the log event. It can include information about the operation, errors encountered, or other relevant details.
### Console
```text theme={null}
2024-01-20T22:04:18-05:00 INFO finished unary call with code OK {"server": "grpc", "grpc.start_time": "2024-01-20T22:04:18-05:00", "system": "grpc", "span.kind": "server", "grpc.service": "flipt.evaluation.EvaluationService", "grpc.method": "Boolean", "peer.address": "127.0.0.1:53714", "grpc.code": "OK", "grpc.time_ms": 0.373}
```
More information about the available configuration options can be found in the [Logging configuration](/v2/configuration/overview#logging) section.
### OTLP
Flipt v2 supports the new [OpenTelemetry OTLP logging specification](https://opentelemetry.io/docs/specs/otel/logs/). To enable OTLP logging, set the `OTLP_LOGS_EXPORTER` environment variable
```console theme={null}
export OTLP_LOGS_EXPORTER=otlp
```
OpenTelemetry logging is in addition to the existing logging configuration. It
does not replace the ability to log to a file or stdout/stderr.
OpenTelemetry OTLP logging is configured via the default OpenTelemetry Environment Variables. See the [OpenTelemetry Environment Variables](https://opentelemetry.io/docs/reference/specification/sdk-environment-variables/) documentation for more details.
For example, to configure the OTLP logging endpoint, you can set the `OTEL_EXPORTER_OTLP_LOGS_ENDPOINT` environment variable.
```console theme={null}
export OTEL_EXPORTER_OTLP_LOGS_ENDPOINT=http://localhost:4317
```
## Tracing
Flipt supports distributed tracing via the [OpenTelemetry](https://opentelemetry.io/) project using the [OTLP](https://opentelemetry.io/docs/reference/specification/protocol/) protocol.
### OTLP
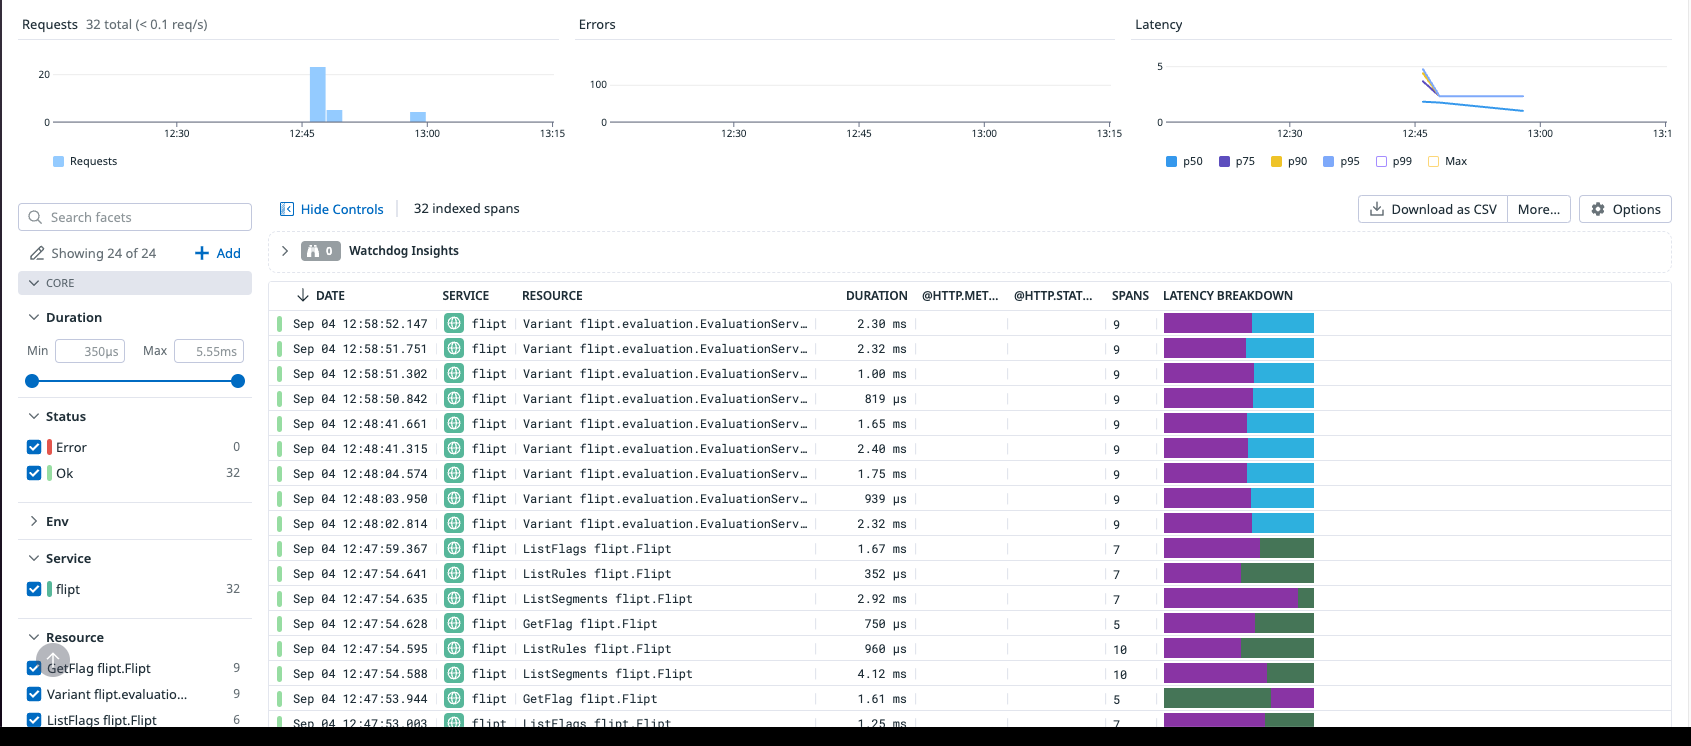 OTLP supports additional configuration such as specifying the protocol to use (gRPC or HTTP) as well as providing custom headers to send with the request.
Custom headers can be used to provide authentication information to the collector which may be required if you are using a hosted collector such as [NewRelic](https://docs.newrelic.com/docs/more-integrations/open-source-telemetry-integrations/opentelemetry/get-started/opentelemetry-set-up-your-app/), [Datadog](https://docs.datadoghq.com/opentelemetry/otlp_ingest_in_the_agent/?tab=host), or [Honeycomb](https://docs.honeycomb.io/getting-data-in/opentelemetry-overview/#instrumenting-with-opentelemetry).
OpenTelemetry OTLP tracing is configured via the default OpenTelemetry Environment Variables. See the [OpenTelemetry Environment Variables](https://opentelemetry.io/docs/reference/specification/sdk-environment-variables/) documentation for more details.
For example, to configure the OTLP tracing endpoint, you can set the `OTEL_EXPORTER_OTLP_TRACES_ENDPOINT` environment variable.
```console theme={null}
export OTEL_EXPORTER_OTLP_TRACES_ENDPOINT=http://localhost:4317
```
To configure the OTLP headers, you can set the `OTEL_EXPORTER_OTLP_TRACES_HEADERS` environment variable.
```console theme={null}
export OTEL_EXPORTER_OTLP_TRACES_HEADERS="Authorization=Bearer "
```
#### Environment Variables
Flipt supports all OTLP environment variables that are part of the [OTLP spec](https://opentelemetry.io/docs/specs/otel/configuration/sdk-environment-variables/).
Here are a few of the most commonly used environment variables supported by Flipt:
* `OTEL_SERVICE_NAME` - Sets the value of the `service.name` resource attribute (default: `flipt`)
* `OTEL_RESOURCE_ATTRIBUTES` - Key-value pairs to be used as [resource attributes](https://opentelemetry.io/docs/specs/semconv/resource/#semantic-attributes-with-dedicated-environment-variable).
* `OTEL_EXPORTER_OTLP_ENDPOINT` - The OTLP endpoint to any signal data (metrics, traces, logs) to
* `OTEL_EXPORTER_OTLP_HEADERS` - Key-value pairs to be used as [OTLP headers](https://opentelemetry.io/docs/specs/otel/configuration/sdk-environment-variables/#otel_exporter_otlp_headers) for any signal data (metrics, traces, logs).
* `OTEL_EXPORTER_OTLP_PROTOCOL` - The protocol to use for the OTLP endpoint (grpc, http/protobuf, http/json)
OTLP supports additional configuration such as specifying the protocol to use (gRPC or HTTP) as well as providing custom headers to send with the request.
Custom headers can be used to provide authentication information to the collector which may be required if you are using a hosted collector such as [NewRelic](https://docs.newrelic.com/docs/more-integrations/open-source-telemetry-integrations/opentelemetry/get-started/opentelemetry-set-up-your-app/), [Datadog](https://docs.datadoghq.com/opentelemetry/otlp_ingest_in_the_agent/?tab=host), or [Honeycomb](https://docs.honeycomb.io/getting-data-in/opentelemetry-overview/#instrumenting-with-opentelemetry).
OpenTelemetry OTLP tracing is configured via the default OpenTelemetry Environment Variables. See the [OpenTelemetry Environment Variables](https://opentelemetry.io/docs/reference/specification/sdk-environment-variables/) documentation for more details.
For example, to configure the OTLP tracing endpoint, you can set the `OTEL_EXPORTER_OTLP_TRACES_ENDPOINT` environment variable.
```console theme={null}
export OTEL_EXPORTER_OTLP_TRACES_ENDPOINT=http://localhost:4317
```
To configure the OTLP headers, you can set the `OTEL_EXPORTER_OTLP_TRACES_HEADERS` environment variable.
```console theme={null}
export OTEL_EXPORTER_OTLP_TRACES_HEADERS="Authorization=Bearer "
```
#### Environment Variables
Flipt supports all OTLP environment variables that are part of the [OTLP spec](https://opentelemetry.io/docs/specs/otel/configuration/sdk-environment-variables/).
Here are a few of the most commonly used environment variables supported by Flipt:
* `OTEL_SERVICE_NAME` - Sets the value of the `service.name` resource attribute (default: `flipt`)
* `OTEL_RESOURCE_ATTRIBUTES` - Key-value pairs to be used as [resource attributes](https://opentelemetry.io/docs/specs/semconv/resource/#semantic-attributes-with-dedicated-environment-variable).
* `OTEL_EXPORTER_OTLP_ENDPOINT` - The OTLP endpoint to any signal data (metrics, traces, logs) to
* `OTEL_EXPORTER_OTLP_HEADERS` - Key-value pairs to be used as [OTLP headers](https://opentelemetry.io/docs/specs/otel/configuration/sdk-environment-variables/#otel_exporter_otlp_headers) for any signal data (metrics, traces, logs).
* `OTEL_EXPORTER_OTLP_PROTOCOL` - The protocol to use for the OTLP endpoint (grpc, http/protobuf, http/json)